|
Download Data (XLS File) |
|
|||||
|
|||||
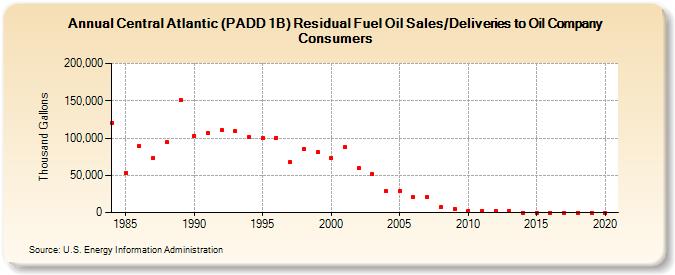
| Central Atlantic (PADD 1B) Residual Fuel Oil Sales/Deliveries to Oil Company Consumers (Thousand Gallons) | |||||
| Decade | Year-0 | Year-1 | Year-2 | Year-3 | Year-4 | Year-5 | Year-6 | Year-7 | Year-8 | Year-9 |
|---|---|---|---|---|---|---|---|---|---|---|
| 1980's | 120,776 | 53,568 | 89,557 | 73,484 | 94,555 | 150,828 | ||||
| 1990's | 103,183 | 107,022 | 110,555 | 109,137 | 101,186 | 100,249 | 100,576 | 67,389 | 84,856 | 80,845 |
| 2000's | 73,228 | 87,553 | 59,483 | 51,432 | 28,801 | 28,670 | 20,212 | 20,584 | 7,113 | 5,017 |
| 2010's | 2,622 | 2,540 | 2,115 | 1,759 | 0 | 0 | 0 | 0 | 0 | 0 |
| 2020's | 0 |
| - = No Data Reported; -- = Not Applicable; NA = Not Available; W = Withheld to avoid disclosure of individual company data. |
| Release Date: 2/9/2022 |
| Next Release Date: Suspended |