|
Download Data (XLS File) |
|
|||||
|
|||||
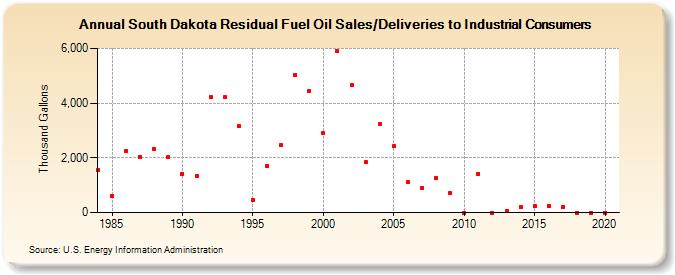
| South Dakota Residual Fuel Oil Sales/Deliveries to Industrial Consumers (Thousand Gallons) | |||||
| Decade | Year-0 | Year-1 | Year-2 | Year-3 | Year-4 | Year-5 | Year-6 | Year-7 | Year-8 | Year-9 |
|---|---|---|---|---|---|---|---|---|---|---|
| 1980's | 1,561 | 608 | 2,236 | 2,023 | 2,314 | 2,036 | ||||
| 1990's | 1,420 | 1,354 | 4,207 | 4,213 | 3,157 | 460 | 1,700 | 2,461 | 5,036 | 4,444 |
| 2000's | 2,890 | 5,913 | 4,662 | 1,830 | 3,223 | 2,416 | 1,104 | 901 | 1,277 | 705 |
| 2010's | 0 | 1,426 | 0 | 59 | 207 | 227 | 234 | 221 | 0 | 0 |
| 2020's | 0 |
| - = No Data Reported; -- = Not Applicable; NA = Not Available; W = Withheld to avoid disclosure of individual company data. |
| Release Date: 2/9/2022 |
| Next Release Date: Suspended |