|
Download Data (XLS File) |
|
|||||
|
|||||
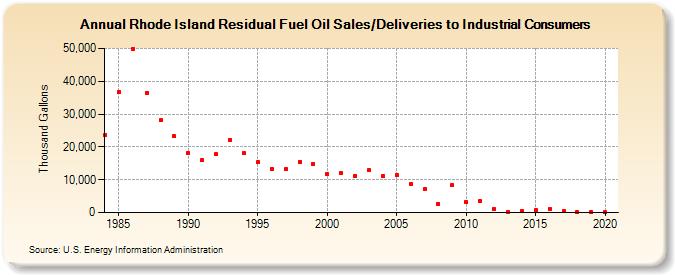
| Rhode Island Residual Fuel Oil Sales/Deliveries to Industrial Consumers (Thousand Gallons) | |||||
| Decade | Year-0 | Year-1 | Year-2 | Year-3 | Year-4 | Year-5 | Year-6 | Year-7 | Year-8 | Year-9 |
|---|---|---|---|---|---|---|---|---|---|---|
| 1980's | 23,472 | 36,701 | 49,785 | 36,551 | 28,079 | 23,233 | ||||
| 1990's | 18,004 | 15,897 | 17,775 | 22,147 | 18,019 | 15,260 | 13,378 | 13,152 | 15,514 | 14,750 |
| 2000's | 11,713 | 11,900 | 11,243 | 12,861 | 11,065 | 11,369 | 8,695 | 7,042 | 2,745 | 8,373 |
| 2010's | 3,167 | 3,489 | 1,073 | 250 | 534 | 773 | 1,110 | 350 | 46 | 62 |
| 2020's | 23 |
| - = No Data Reported; -- = Not Applicable; NA = Not Available; W = Withheld to avoid disclosure of individual company data. |
| Release Date: 2/9/2022 |
| Next Release Date: Suspended |