|
Download Data (XLS File) |
|
|||||
|
|||||
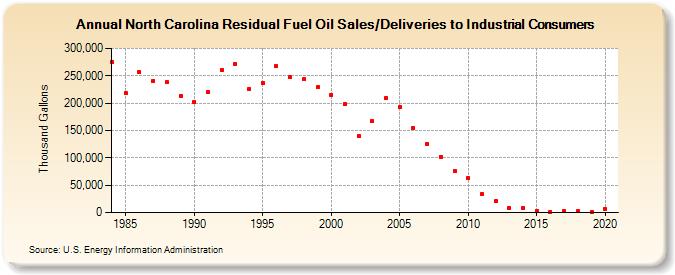
| North Carolina Residual Fuel Oil Sales/Deliveries to Industrial Consumers (Thousand Gallons) | |||||
| Decade | Year-0 | Year-1 | Year-2 | Year-3 | Year-4 | Year-5 | Year-6 | Year-7 | Year-8 | Year-9 |
|---|---|---|---|---|---|---|---|---|---|---|
| 1980's | 274,918 | 217,792 | 256,076 | 240,937 | 237,856 | 213,468 | ||||
| 1990's | 201,815 | 220,235 | 261,275 | 271,774 | 226,078 | 236,862 | 266,980 | 247,221 | 243,334 | 228,616 |
| 2000's | 215,221 | 197,551 | 139,573 | 167,292 | 209,614 | 192,187 | 154,738 | 125,901 | 101,675 | 76,212 |
| 2010's | 63,463 | 33,887 | 20,563 | 9,032 | 8,874 | 3,389 | 1,644 | 2,030 | 2,280 | 1,438 |
| 2020's | 6,460 |
| - = No Data Reported; -- = Not Applicable; NA = Not Available; W = Withheld to avoid disclosure of individual company data. |
| Release Date: 2/9/2022 |
| Next Release Date: Suspended |