|
Download Data (XLS File) |
|
|||||
|
|||||
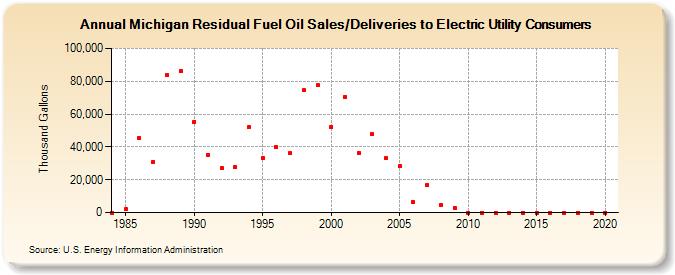
| Michigan Residual Fuel Oil Sales/Deliveries to Electric Utility Consumers (Thousand Gallons) | |||||
| Decade | Year-0 | Year-1 | Year-2 | Year-3 | Year-4 | Year-5 | Year-6 | Year-7 | Year-8 | Year-9 |
|---|---|---|---|---|---|---|---|---|---|---|
| 1980's | 0 | 1,985 | 45,368 | 30,855 | 84,071 | 86,356 | ||||
| 1990's | 55,459 | 35,348 | 27,265 | 27,556 | 51,822 | 33,394 | 39,797 | 36,120 | 74,610 | 77,537 |
| 2000's | 52,237 | 70,618 | 36,342 | 47,627 | 32,937 | 28,133 | 6,140 | 16,605 | 4,368 | 2,929 |
| 2010's | 11 | 0 | 0 | 0 | 0 | 0 | 0 | 0 | 0 | 0 |
| 2020's | 0 |
| - = No Data Reported; -- = Not Applicable; NA = Not Available; W = Withheld to avoid disclosure of individual company data. |
| Release Date: 2/9/2022 |
| Next Release Date: Suspended |