|
Download Data (XLS File) |
|
|||||
|
|||||
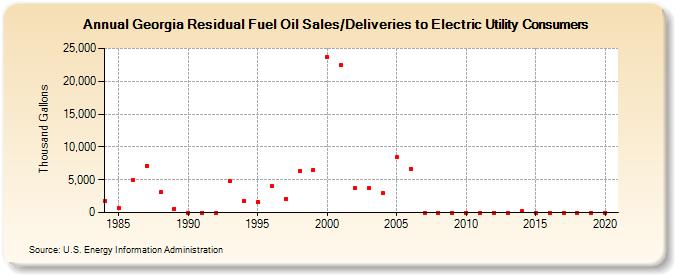
| Georgia Residual Fuel Oil Sales/Deliveries to Electric Utility Consumers (Thousand Gallons) | |||||
| Decade | Year-0 | Year-1 | Year-2 | Year-3 | Year-4 | Year-5 | Year-6 | Year-7 | Year-8 | Year-9 |
|---|---|---|---|---|---|---|---|---|---|---|
| 1980's | 1,815 | 674 | 4,970 | 7,087 | 3,081 | 610 | ||||
| 1990's | 0 | 0 | 0 | 4,744 | 1,822 | 1,637 | 4,113 | 2,117 | 6,373 | 6,522 |
| 2000's | 23,639 | 22,490 | 3,690 | 3,697 | 2,949 | 8,410 | 6,692 | 0 | 0 | 0 |
| 2010's | 0 | 0 | 0 | 0 | 265 | 0 | 0 | 0 | 0 | 0 |
| 2020's | 0 |
| - = No Data Reported; -- = Not Applicable; NA = Not Available; W = Withheld to avoid disclosure of individual company data. |
| Release Date: 2/9/2022 |
| Next Release Date: Suspended |