|
Download Data (XLS File) |
|
|||||
|
|||||
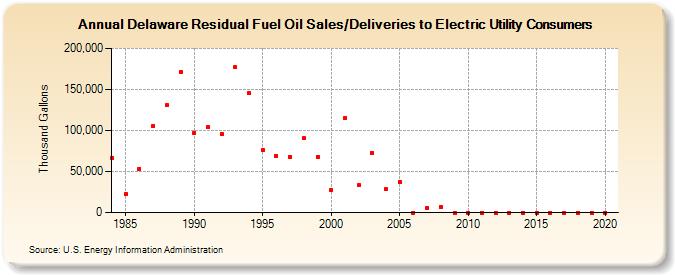
| Delaware Residual Fuel Oil Sales/Deliveries to Electric Utility Consumers (Thousand Gallons) | |||||
| Decade | Year-0 | Year-1 | Year-2 | Year-3 | Year-4 | Year-5 | Year-6 | Year-7 | Year-8 | Year-9 |
|---|---|---|---|---|---|---|---|---|---|---|
| 1980's | 66,578 | 22,324 | 53,629 | 105,589 | 130,677 | 171,304 | ||||
| 1990's | 97,380 | 103,812 | 96,185 | 176,776 | 145,196 | 76,774 | 68,711 | 68,252 | 90,705 | 68,127 |
| 2000's | 27,759 | 115,478 | 33,212 | 73,067 | 28,365 | 37,305 | 0 | 6,126 | 7,347 | 0 |
| 2010's | 0 | 0 | 0 | 0 | 0 | 0 | 0 | 0 | 0 | 0 |
| 2020's | 0 |
| - = No Data Reported; -- = Not Applicable; NA = Not Available; W = Withheld to avoid disclosure of individual company data. |
| Release Date: 2/9/2022 |
| Next Release Date: Suspended |