|
Download Data (XLS File) |
|
|||||
|
|||||
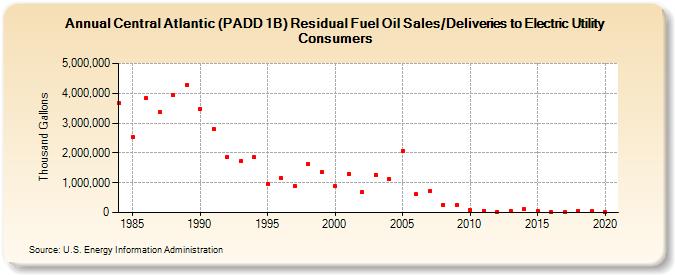
| Central Atlantic (PADD 1B) Residual Fuel Oil Sales/Deliveries to Electric Utility Consumers (Thousand Gallons) | |||||
| Decade | Year-0 | Year-1 | Year-2 | Year-3 | Year-4 | Year-5 | Year-6 | Year-7 | Year-8 | Year-9 |
|---|---|---|---|---|---|---|---|---|---|---|
| 1980's | 3,660,650 | 2,531,971 | 3,847,138 | 3,371,014 | 3,927,926 | 4,279,018 | ||||
| 1990's | 3,471,615 | 2,810,692 | 1,862,074 | 1,714,622 | 1,850,373 | 963,580 | 1,166,608 | 887,574 | 1,618,177 | 1,356,915 |
| 2000's | 880,352 | 1,304,358 | 683,071 | 1,261,743 | 1,121,164 | 2,069,711 | 612,111 | 715,339 | 265,234 | 238,228 |
| 2010's | 82,439 | 61,353 | 34,766 | 47,335 | 113,719 | 53,170 | 13,962 | 24,721 | 64,725 | 41,752 |
| 2020's | 13,606 |
| - = No Data Reported; -- = Not Applicable; NA = Not Available; W = Withheld to avoid disclosure of individual company data. |
| Release Date: 2/9/2022 |
| Next Release Date: Suspended |