|
Download Data (XLS File) |
|
|||||
|
|||||
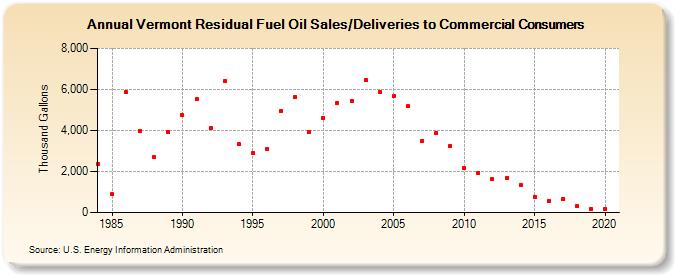
| Vermont Residual Fuel Oil Sales/Deliveries to Commercial Consumers (Thousand Gallons) | |||||
| Decade | Year-0 | Year-1 | Year-2 | Year-3 | Year-4 | Year-5 | Year-6 | Year-7 | Year-8 | Year-9 |
|---|---|---|---|---|---|---|---|---|---|---|
| 1980's | 2,369 | 891 | 5,851 | 3,998 | 2,684 | 3,905 | ||||
| 1990's | 4,742 | 5,520 | 4,106 | 6,401 | 3,328 | 2,892 | 3,081 | 4,956 | 5,631 | 3,949 |
| 2000's | 4,623 | 5,350 | 5,442 | 6,470 | 5,885 | 5,656 | 5,184 | 3,490 | 3,884 | 3,241 |
| 2010's | 2,159 | 1,948 | 1,633 | 1,683 | 1,322 | 781 | 558 | 656 | 300 | 164 |
| 2020's | 187 |
| - = No Data Reported; -- = Not Applicable; NA = Not Available; W = Withheld to avoid disclosure of individual company data. |
| Release Date: 2/9/2022 |
| Next Release Date: Suspended |