|
Download Data (XLS File) |
|
|||||
|
|||||
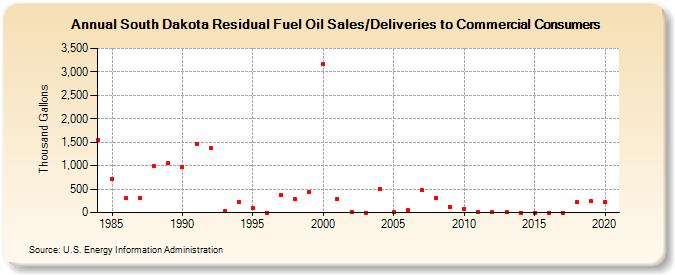
| South Dakota Residual Fuel Oil Sales/Deliveries to Commercial Consumers (Thousand Gallons) | |||||
| Decade | Year-0 | Year-1 | Year-2 | Year-3 | Year-4 | Year-5 | Year-6 | Year-7 | Year-8 | Year-9 |
|---|---|---|---|---|---|---|---|---|---|---|
| 1980's | 1,550 | 707 | 306 | 321 | 982 | 1,053 | ||||
| 1990's | 973 | 1,470 | 1,378 | 27 | 235 | 100 | 0 | 375 | 283 | 429 |
| 2000's | 3,161 | 283 | 14 | 0 | 511 | 6 | 48 | 484 | 321 | 124 |
| 2010's | 82 | 13 | 8 | 17 | 0 | 0 | 0 | 0 | 227 | 239 |
| 2020's | 230 |
| - = No Data Reported; -- = Not Applicable; NA = Not Available; W = Withheld to avoid disclosure of individual company data. |
| Release Date: 2/9/2022 |
| Next Release Date: Suspended |