|
Download Data (XLS File) |
|
|||||
|
|||||
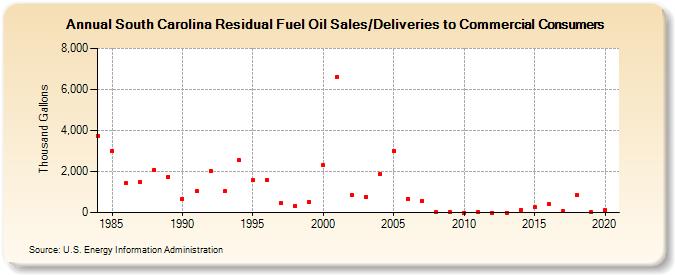
| South Carolina Residual Fuel Oil Sales/Deliveries to Commercial Consumers (Thousand Gallons) | |||||
| Decade | Year-0 | Year-1 | Year-2 | Year-3 | Year-4 | Year-5 | Year-6 | Year-7 | Year-8 | Year-9 |
|---|---|---|---|---|---|---|---|---|---|---|
| 1980's | 3,743 | 3,003 | 1,427 | 1,479 | 2,071 | 1,746 | ||||
| 1990's | 683 | 1,036 | 2,038 | 1,033 | 2,538 | 1,566 | 1,592 | 450 | 341 | 532 |
| 2000's | 2,299 | 6,612 | 848 | 773 | 1,867 | 3,017 | 671 | 578 | 20 | 13 |
| 2010's | 0 | 20 | 0 | 0 | 121 | 258 | 400 | 55 | 847 | 3 |
| 2020's | 125 |
| - = No Data Reported; -- = Not Applicable; NA = Not Available; W = Withheld to avoid disclosure of individual company data. |
| Release Date: 2/9/2022 |
| Next Release Date: Suspended |