|
Download Data (XLS File) |
|
|||||
|
|||||
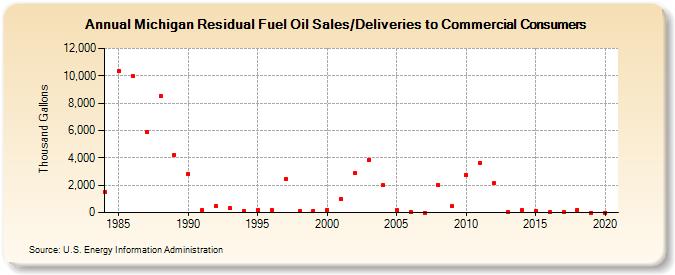
| Michigan Residual Fuel Oil Sales/Deliveries to Commercial Consumers (Thousand Gallons) | |||||
| Decade | Year-0 | Year-1 | Year-2 | Year-3 | Year-4 | Year-5 | Year-6 | Year-7 | Year-8 | Year-9 |
|---|---|---|---|---|---|---|---|---|---|---|
| 1980's | 1,532 | 10,349 | 9,961 | 5,867 | 8,527 | 4,215 | ||||
| 1990's | 2,837 | 201 | 458 | 297 | 130 | 197 | 194 | 2,474 | 87 | 146 |
| 2000's | 218 | 995 | 2,888 | 3,862 | 1,980 | 175 | 74 | 0 | 2,007 | 453 |
| 2010's | 2,752 | 3,643 | 2,126 | 24 | 204 | 126 | 10 | 14 | 204 | 0 |
| 2020's | 0 |
| - = No Data Reported; -- = Not Applicable; NA = Not Available; W = Withheld to avoid disclosure of individual company data. |
| Release Date: 2/9/2022 |
| Next Release Date: Suspended |