|
Download Data (XLS File) |
|
|||||
|
|||||
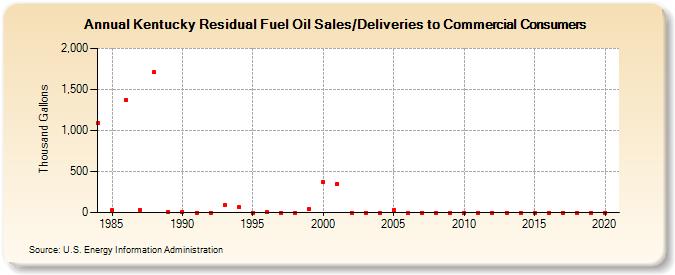
| Kentucky Residual Fuel Oil Sales/Deliveries to Commercial Consumers (Thousand Gallons) | |||||
| Decade | Year-0 | Year-1 | Year-2 | Year-3 | Year-4 | Year-5 | Year-6 | Year-7 | Year-8 | Year-9 |
|---|---|---|---|---|---|---|---|---|---|---|
| 1980's | 1,085 | 29 | 1,374 | 37 | 1,708 | 12 | ||||
| 1990's | 12 | 0 | 0 | 88 | 70 | 0 | 7 | 0 | 0 | 40 |
| 2000's | 371 | 350 | 0 | 0 | 0 | 35 | 0 | 0 | 0 | 0 |
| 2010's | 0 | 0 | 0 | 0 | 0 | 0 | 0 | 0 | 0 | 0 |
| 2020's | 0 |
| - = No Data Reported; -- = Not Applicable; NA = Not Available; W = Withheld to avoid disclosure of individual company data. |
| Release Date: 2/9/2022 |
| Next Release Date: Suspended |