|
Download Data (XLS File) |
|
|||||
|
|||||
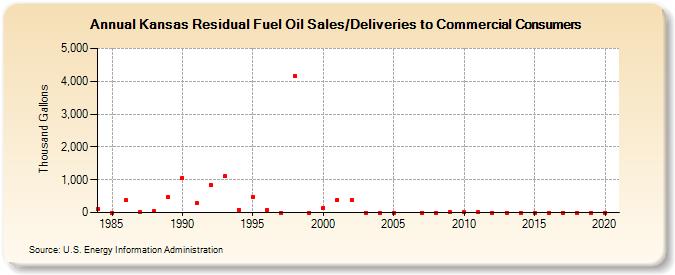
| Kansas Residual Fuel Oil Sales/Deliveries to Commercial Consumers (Thousand Gallons) | |||||
| Decade | Year-0 | Year-1 | Year-2 | Year-3 | Year-4 | Year-5 | Year-6 | Year-7 | Year-8 | Year-9 |
|---|---|---|---|---|---|---|---|---|---|---|
| 1980's | 123 | 0 | 376 | 13 | 33 | 465 | ||||
| 1990's | 1,058 | 292 | 847 | 1,102 | 93 | 483 | 76 | 0 | 4,159 | 0 |
| 2000's | 144 | 391 | 390 | 0 | 0 | 0 | -- | 0 | 0 | 9 |
| 2010's | 6 | 4 | 0 | 0 | 0 | 0 | 0 | 0 | 0 | 0 |
| 2020's | 0 |
| - = No Data Reported; -- = Not Applicable; NA = Not Available; W = Withheld to avoid disclosure of individual company data. |
| Release Date: 2/9/2022 |
| Next Release Date: Suspended |