|
Download Data (XLS File) |
|
|||||
|
|||||
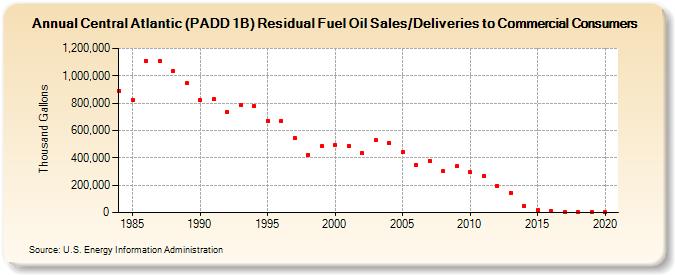
| Central Atlantic (PADD 1B) Residual Fuel Oil Sales/Deliveries to Commercial Consumers (Thousand Gallons) | |||||
| Decade | Year-0 | Year-1 | Year-2 | Year-3 | Year-4 | Year-5 | Year-6 | Year-7 | Year-8 | Year-9 |
|---|---|---|---|---|---|---|---|---|---|---|
| 1980's | 889,126 | 823,176 | 1,110,748 | 1,109,494 | 1,031,628 | 946,321 | ||||
| 1990's | 819,357 | 829,311 | 736,396 | 784,108 | 777,750 | 672,123 | 671,825 | 544,746 | 423,295 | 483,271 |
| 2000's | 495,051 | 485,510 | 433,113 | 527,840 | 508,662 | 439,849 | 346,426 | 380,176 | 301,290 | 338,089 |
| 2010's | 293,145 | 268,935 | 195,010 | 145,522 | 47,108 | 15,838 | 10,510 | 7,121 | 4,722 | 3,040 |
| 2020's | 2,094 |
| - = No Data Reported; -- = Not Applicable; NA = Not Available; W = Withheld to avoid disclosure of individual company data. |
| Release Date: 2/9/2022 |
| Next Release Date: Suspended |