|
Download Data (XLS File) |
|
|||||
|
|||||
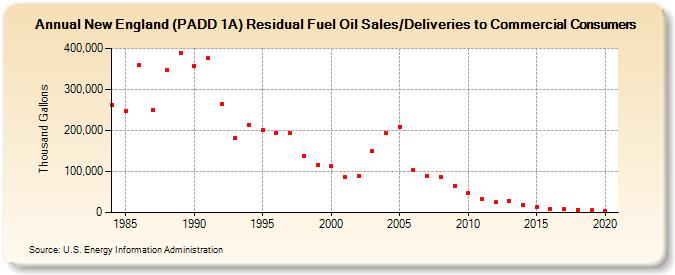
| New England (PADD 1A) Residual Fuel Oil Sales/Deliveries to Commercial Consumers (Thousand Gallons) | |||||
| Decade | Year-0 | Year-1 | Year-2 | Year-3 | Year-4 | Year-5 | Year-6 | Year-7 | Year-8 | Year-9 |
|---|---|---|---|---|---|---|---|---|---|---|
| 1980's | 262,897 | 246,565 | 359,029 | 250,888 | 347,441 | 389,952 | ||||
| 1990's | 358,291 | 375,884 | 263,585 | 182,098 | 214,061 | 200,493 | 194,722 | 193,704 | 138,729 | 114,759 |
| 2000's | 114,156 | 86,149 | 88,501 | 150,209 | 192,682 | 208,830 | 102,505 | 88,161 | 86,937 | 64,826 |
| 2010's | 47,270 | 33,350 | 24,981 | 29,104 | 18,130 | 12,388 | 9,477 | 7,527 | 6,950 | 6,229 |
| 2020's | 4,425 |
| - = No Data Reported; -- = Not Applicable; NA = Not Available; W = Withheld to avoid disclosure of individual company data. |
| Release Date: 2/9/2022 |
| Next Release Date: Suspended |