|
Download Data (XLS File) |
|
|||||
|
|||||
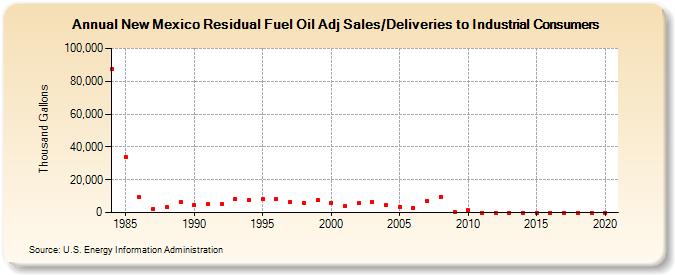
| New Mexico Residual Fuel Oil Adj Sales/Deliveries to Industrial Consumers (Thousand Gallons) | |||||
| Decade | Year-0 | Year-1 | Year-2 | Year-3 | Year-4 | Year-5 | Year-6 | Year-7 | Year-8 | Year-9 |
|---|---|---|---|---|---|---|---|---|---|---|
| 1980's | 87,447 | 33,972 | 9,248 | 2,372 | 3,287 | 6,361 | ||||
| 1990's | 4,533 | 4,925 | 5,423 | 7,978 | 7,532 | 8,001 | 8,389 | 6,695 | 5,885 | 7,467 |
| 2000's | 5,928 | 3,939 | 5,818 | 6,573 | 4,355 | 3,614 | 3,031 | 6,795 | 9,751 | 410 |
| 2010's | 1,451 | 0 | 0 | 0 | 0 | 0 | 0 | 0 | 0 | 0 |
| 2020's | 0 |
| - = No Data Reported; -- = Not Applicable; NA = Not Available; W = Withheld to avoid disclosure of individual company data. |
| Release Date: 2/9/2022 |
| Next Release Date: Suspended |