|
Download Data (XLS File) |
|
|||||
|
|||||
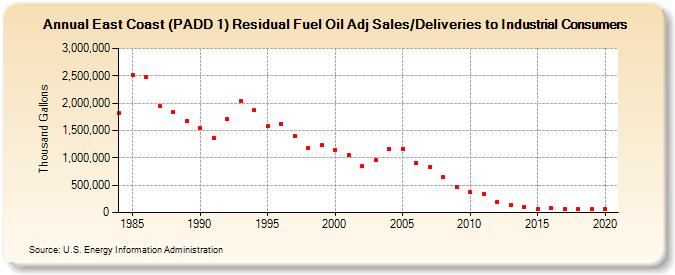
| East Coast (PADD 1) Residual Fuel Oil Adj Sales/Deliveries to Industrial Consumers (Thousand Gallons) | |||||
| Decade | Year-0 | Year-1 | Year-2 | Year-3 | Year-4 | Year-5 | Year-6 | Year-7 | Year-8 | Year-9 |
|---|---|---|---|---|---|---|---|---|---|---|
| 1980's | 1,813,450 | 2,516,557 | 2,484,756 | 1,949,969 | 1,839,876 | 1,672,079 | ||||
| 1990's | 1,549,585 | 1,369,195 | 1,716,820 | 2,047,748 | 1,867,639 | 1,573,973 | 1,624,561 | 1,398,504 | 1,184,856 | 1,235,458 |
| 2000's | 1,147,289 | 1,050,758 | 845,769 | 959,483 | 1,166,329 | 1,164,479 | 909,943 | 827,515 | 647,978 | 472,871 |
| 2010's | 367,711 | 345,745 | 193,333 | 130,509 | 96,127 | 65,883 | 83,879 | 59,500 | 60,790 | 61,792 |
| 2020's | 56,933 |
| - = No Data Reported; -- = Not Applicable; NA = Not Available; W = Withheld to avoid disclosure of individual company data. |
| Release Date: 2/9/2022 |
| Next Release Date: Suspended |