|
Download Data (XLS File) |
|
|||||
|
|||||
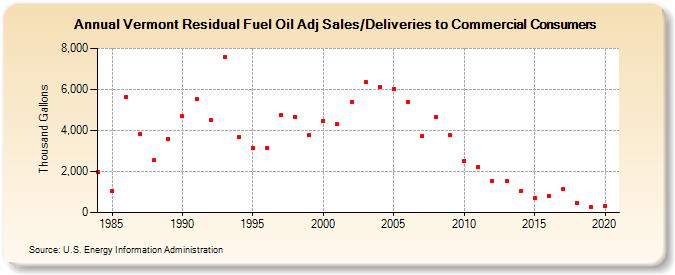
| Vermont Residual Fuel Oil Adj Sales/Deliveries to Commercial Consumers (Thousand Gallons) | |||||
| Decade | Year-0 | Year-1 | Year-2 | Year-3 | Year-4 | Year-5 | Year-6 | Year-7 | Year-8 | Year-9 |
|---|---|---|---|---|---|---|---|---|---|---|
| 1980's | 1,958 | 1,028 | 5,653 | 3,843 | 2,545 | 3,595 | ||||
| 1990's | 4,683 | 5,531 | 4,504 | 7,598 | 3,673 | 3,160 | 3,137 | 4,738 | 4,649 | 3,787 |
| 2000's | 4,466 | 4,298 | 5,371 | 6,349 | 6,132 | 6,044 | 5,407 | 3,736 | 4,634 | 3,766 |
| 2010's | 2,532 | 2,224 | 1,545 | 1,549 | 1,027 | 722 | 798 | 1,137 | 460 | 265 |
| 2020's | 338 |
| - = No Data Reported; -- = Not Applicable; NA = Not Available; W = Withheld to avoid disclosure of individual company data. |
| Release Date: 2/9/2022 |
| Next Release Date: Suspended |