|
Download Data (XLS File) |
|
|||||
|
|||||
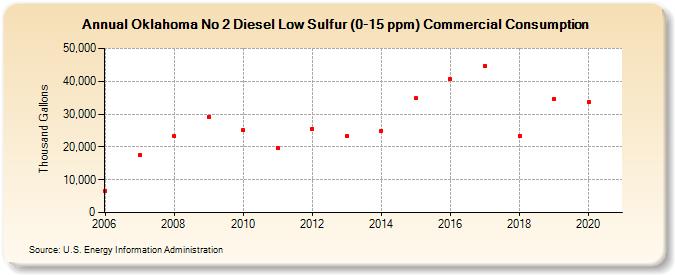
| Oklahoma No 2 Diesel Low Sulfur (0-15 ppm) Commercial Consumption (Thousand Gallons) | |||||
| Decade | Year-0 | Year-1 | Year-2 | Year-3 | Year-4 | Year-5 | Year-6 | Year-7 | Year-8 | Year-9 |
|---|---|---|---|---|---|---|---|---|---|---|
| 2000's | 6,636 | 17,563 | 23,240 | 29,242 | ||||||
| 2010's | 25,005 | 19,758 | 25,449 | 23,290 | 24,975 | 34,861 | 40,585 | 44,615 | 23,427 | 34,676 |
| 2020's | 33,603 |
| - = No Data Reported; -- = Not Applicable; NA = Not Available; W = Withheld to avoid disclosure of individual company data. |
| Release Date: 2/9/2022 |
| Next Release Date: Suspended |