|
Download Data (XLS File) |
|
|||||
|
|||||
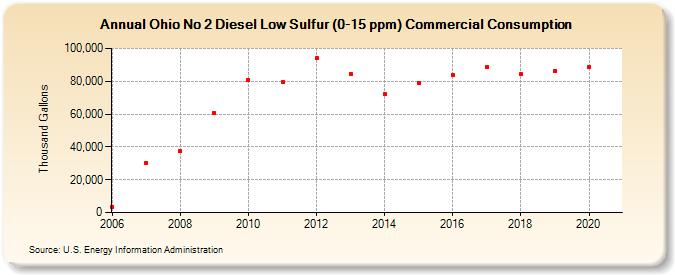
| Ohio No 2 Diesel Low Sulfur (0-15 ppm) Commercial Consumption (Thousand Gallons) | |||||
| Decade | Year-0 | Year-1 | Year-2 | Year-3 | Year-4 | Year-5 | Year-6 | Year-7 | Year-8 | Year-9 |
|---|---|---|---|---|---|---|---|---|---|---|
| 2000's | 3,681 | 30,488 | 37,230 | 60,509 | ||||||
| 2010's | 80,607 | 79,562 | 93,983 | 84,587 | 72,131 | 79,071 | 83,682 | 88,626 | 84,102 | 86,306 |
| 2020's | 88,960 |
| - = No Data Reported; -- = Not Applicable; NA = Not Available; W = Withheld to avoid disclosure of individual company data. |
| Release Date: 2/9/2022 |
| Next Release Date: Suspended |