|
Download Data (XLS File) |
|
|||||
|
|||||
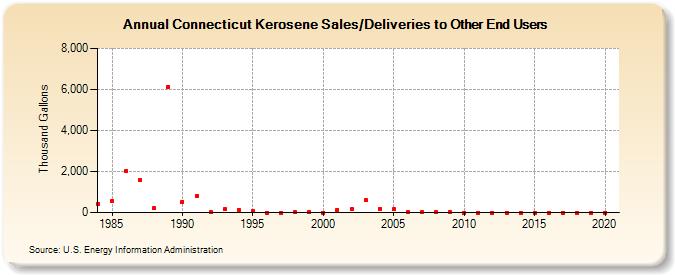
| Connecticut Kerosene Sales/Deliveries to Other End Users (Thousand Gallons) | |||||
| Decade | Year-0 | Year-1 | Year-2 | Year-3 | Year-4 | Year-5 | Year-6 | Year-7 | Year-8 | Year-9 |
|---|---|---|---|---|---|---|---|---|---|---|
| 1980's | 440 | 558 | 2,028 | 1,581 | 202 | 6,137 | ||||
| 1990's | 527 | 830 | 11 | 159 | 129 | 58 | 0 | 0 | 18 | 24 |
| 2000's | 1 | 135 | 155 | 605 | 196 | 159 | 9 | 8 | 5 | 18 |
| 2010's | 0 | 0 | 0 | 0 | 0 | 0 | 0 | 0 | 0 | 0 |
| 2020's | 0 |
| - = No Data Reported; -- = Not Applicable; NA = Not Available; W = Withheld to avoid disclosure of individual company data. |
| Release Date: 2/9/2022 |
| Next Release Date: Suspended |