|
Download Data (XLS File) |
|
|||||
|
|||||
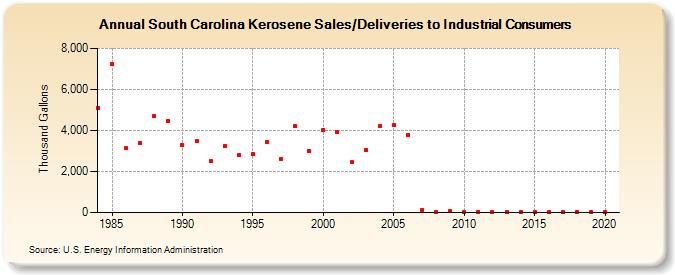
| South Carolina Kerosene Sales/Deliveries to Industrial Consumers (Thousand Gallons) | |||||
| Decade | Year-0 | Year-1 | Year-2 | Year-3 | Year-4 | Year-5 | Year-6 | Year-7 | Year-8 | Year-9 |
|---|---|---|---|---|---|---|---|---|---|---|
| 1980's | 5,095 | 7,220 | 3,124 | 3,387 | 4,690 | 4,468 | ||||
| 1990's | 3,299 | 3,472 | 2,508 | 3,236 | 2,786 | 2,849 | 3,417 | 2,629 | 4,202 | 3,021 |
| 2000's | 4,008 | 3,929 | 2,458 | 3,039 | 4,212 | 4,261 | 3,802 | 148 | 50 | 78 |
| 2010's | 28 | 50 | 13 | 7 | 12 | 16 | 12 | 3 | 8 | 11 |
| 2020's | 12 |
| - = No Data Reported; -- = Not Applicable; NA = Not Available; W = Withheld to avoid disclosure of individual company data. |
| Release Date: 2/9/2022 |
| Next Release Date: Suspended |