|
Download Data (XLS File) |
|
|||||
|
|||||
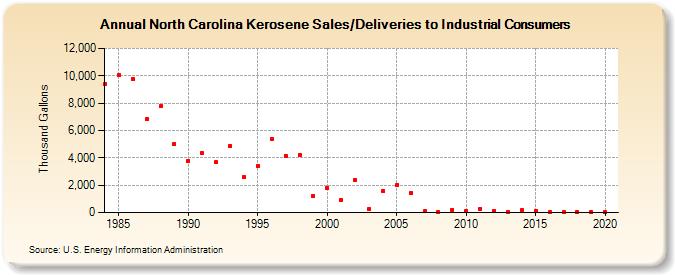
| North Carolina Kerosene Sales/Deliveries to Industrial Consumers (Thousand Gallons) | |||||
| Decade | Year-0 | Year-1 | Year-2 | Year-3 | Year-4 | Year-5 | Year-6 | Year-7 | Year-8 | Year-9 |
|---|---|---|---|---|---|---|---|---|---|---|
| 1980's | 9,390 | 10,045 | 9,764 | 6,817 | 7,788 | 5,025 | ||||
| 1990's | 3,771 | 4,320 | 3,688 | 4,887 | 2,604 | 3,429 | 5,399 | 4,154 | 4,209 | 1,200 |
| 2000's | 1,778 | 943 | 2,416 | 265 | 1,570 | 2,008 | 1,426 | 78 | 39 | 219 |
| 2010's | 134 | 295 | 135 | 71 | 158 | 136 | 51 | 21 | 24 | 13 |
| 2020's | 27 |
| - = No Data Reported; -- = Not Applicable; NA = Not Available; W = Withheld to avoid disclosure of individual company data. |
| Release Date: 2/9/2022 |
| Next Release Date: Suspended |