|
Download Data (XLS File) |
|
|||||
|
|||||
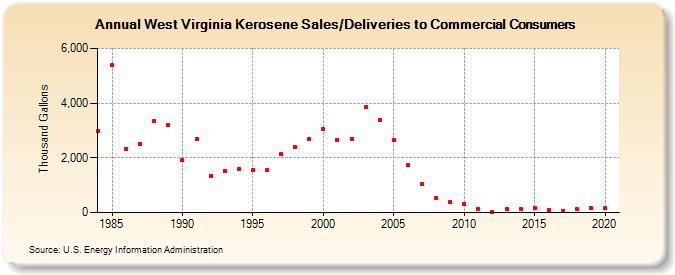
| West Virginia Kerosene Sales/Deliveries to Commercial Consumers (Thousand Gallons) | |||||
| Decade | Year-0 | Year-1 | Year-2 | Year-3 | Year-4 | Year-5 | Year-6 | Year-7 | Year-8 | Year-9 |
|---|---|---|---|---|---|---|---|---|---|---|
| 1980's | 2,966 | 5,402 | 2,329 | 2,511 | 3,330 | 3,191 | ||||
| 1990's | 1,925 | 2,701 | 1,329 | 1,531 | 1,598 | 1,542 | 1,538 | 2,140 | 2,390 | 2,694 |
| 2000's | 3,050 | 2,660 | 2,701 | 3,874 | 3,399 | 2,660 | 1,724 | 1,053 | 533 | 390 |
| 2010's | 321 | 134 | 30 | 124 | 127 | 168 | 97 | 74 | 119 | 151 |
| 2020's | 156 |
| - = No Data Reported; -- = Not Applicable; NA = Not Available; W = Withheld to avoid disclosure of individual company data. |
| Release Date: 2/9/2022 |
| Next Release Date: Suspended |