|
Download Data (XLS File) |
|
|||||
|
|||||
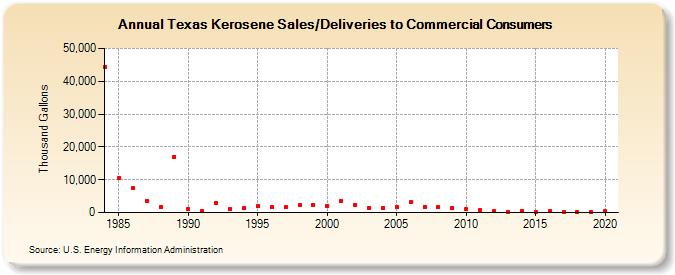
| Texas Kerosene Sales/Deliveries to Commercial Consumers (Thousand Gallons) | |||||
| Decade | Year-0 | Year-1 | Year-2 | Year-3 | Year-4 | Year-5 | Year-6 | Year-7 | Year-8 | Year-9 |
|---|---|---|---|---|---|---|---|---|---|---|
| 1980's | 44,251 | 10,516 | 7,431 | 3,439 | 1,735 | 17,020 | ||||
| 1990's | 1,039 | 522 | 2,866 | 1,029 | 1,238 | 1,940 | 1,577 | 1,593 | 2,198 | 2,374 |
| 2000's | 2,025 | 3,511 | 2,416 | 1,461 | 1,442 | 1,827 | 3,087 | 1,808 | 1,595 | 1,444 |
| 2010's | 962 | 795 | 380 | 208 | 562 | 311 | 485 | 206 | 211 | 262 |
| 2020's | 384 |
| - = No Data Reported; -- = Not Applicable; NA = Not Available; W = Withheld to avoid disclosure of individual company data. |
| Release Date: 2/9/2022 |
| Next Release Date: Suspended |