|
Download Data (XLS File) |
|
|||||
|
|||||
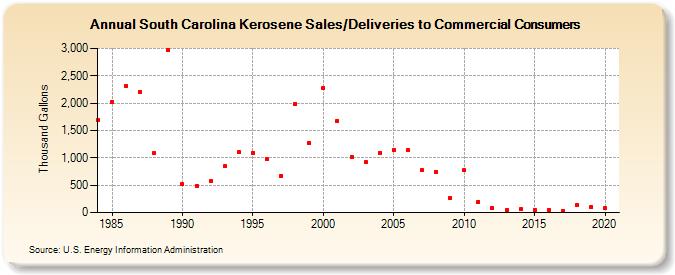
| South Carolina Kerosene Sales/Deliveries to Commercial Consumers (Thousand Gallons) | |||||
| Decade | Year-0 | Year-1 | Year-2 | Year-3 | Year-4 | Year-5 | Year-6 | Year-7 | Year-8 | Year-9 |
|---|---|---|---|---|---|---|---|---|---|---|
| 1980's | 1,697 | 2,023 | 2,320 | 2,212 | 1,089 | 2,965 | ||||
| 1990's | 515 | 488 | 572 | 845 | 1,100 | 1,094 | 977 | 677 | 1,984 | 1,277 |
| 2000's | 2,280 | 1,680 | 1,022 | 920 | 1,095 | 1,148 | 1,136 | 774 | 749 | 272 |
| 2010's | 770 | 199 | 85 | 41 | 61 | 50 | 43 | 28 | 133 | 106 |
| 2020's | 84 |
| - = No Data Reported; -- = Not Applicable; NA = Not Available; W = Withheld to avoid disclosure of individual company data. |
| Release Date: 2/9/2022 |
| Next Release Date: Suspended |