|
Download Data (XLS File) |
|
|||||
|
|||||
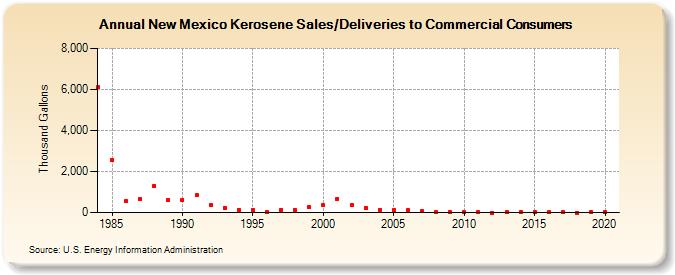
| New Mexico Kerosene Sales/Deliveries to Commercial Consumers (Thousand Gallons) | |||||
| Decade | Year-0 | Year-1 | Year-2 | Year-3 | Year-4 | Year-5 | Year-6 | Year-7 | Year-8 | Year-9 |
|---|---|---|---|---|---|---|---|---|---|---|
| 1980's | 6,097 | 2,557 | 545 | 643 | 1,307 | 600 | ||||
| 1990's | 633 | 840 | 368 | 242 | 125 | 147 | 31 | 120 | 119 | 254 |
| 2000's | 345 | 680 | 355 | 238 | 139 | 125 | 106 | 68 | 9 | 13 |
| 2010's | 12 | 7 | 2 | 3 | 8 | 5 | 8 | 3 | 1 | 3 |
| 2020's | 29 |
| - = No Data Reported; -- = Not Applicable; NA = Not Available; W = Withheld to avoid disclosure of individual company data. |
| Release Date: 2/9/2022 |
| Next Release Date: Suspended |