|
Download Data (XLS File) |
|
|||||
|
|||||
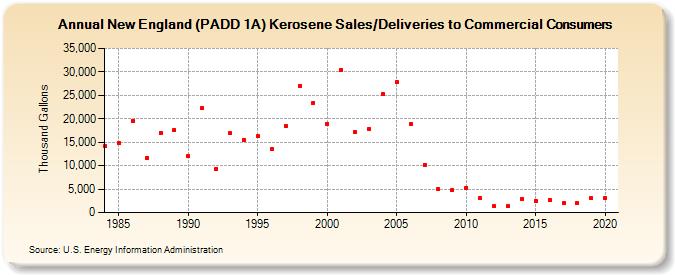
| New England (PADD 1A) Kerosene Sales/Deliveries to Commercial Consumers (Thousand Gallons) | |||||
| Decade | Year-0 | Year-1 | Year-2 | Year-3 | Year-4 | Year-5 | Year-6 | Year-7 | Year-8 | Year-9 |
|---|---|---|---|---|---|---|---|---|---|---|
| 1980's | 14,179 | 14,762 | 19,584 | 11,666 | 17,057 | 17,623 | ||||
| 1990's | 11,995 | 22,263 | 9,357 | 16,878 | 15,420 | 16,254 | 13,593 | 18,515 | 27,038 | 23,426 |
| 2000's | 18,957 | 30,483 | 17,163 | 17,916 | 25,195 | 27,857 | 18,940 | 10,169 | 4,949 | 4,792 |
| 2010's | 5,266 | 3,051 | 1,310 | 1,306 | 2,972 | 2,472 | 2,770 | 2,065 | 1,988 | 3,085 |
| 2020's | 3,116 |
| - = No Data Reported; -- = Not Applicable; NA = Not Available; W = Withheld to avoid disclosure of individual company data. |
| Release Date: 2/9/2022 |
| Next Release Date: Suspended |