|
Download Data (XLS File) |
|
|||||
|
|||||
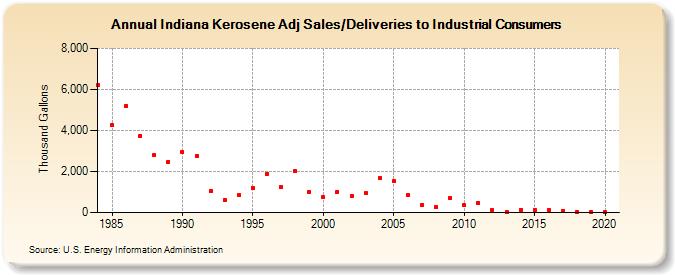
| Indiana Kerosene Adj Sales/Deliveries to Industrial Consumers (Thousand Gallons) | |||||
| Decade | Year-0 | Year-1 | Year-2 | Year-3 | Year-4 | Year-5 | Year-6 | Year-7 | Year-8 | Year-9 |
|---|---|---|---|---|---|---|---|---|---|---|
| 1980's | 6,199 | 4,270 | 5,210 | 3,750 | 2,782 | 2,484 | ||||
| 1990's | 2,951 | 2,762 | 1,054 | 617 | 857 | 1,221 | 1,903 | 1,257 | 2,024 | 1,021 |
| 2000's | 755 | 1,016 | 805 | 948 | 1,693 | 1,527 | 841 | 375 | 265 | 726 |
| 2010's | 357 | 474 | 121 | 29 | 132 | 132 | 109 | 81 | 39 | 36 |
| 2020's | 23 |
| - = No Data Reported; -- = Not Applicable; NA = Not Available; W = Withheld to avoid disclosure of individual company data. |
| Release Date: 2/9/2022 |
| Next Release Date: Suspended |