|
Download Data (XLS File) |
|
|||||
|
|||||
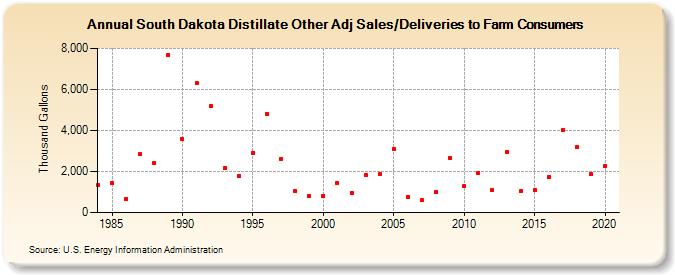
| South Dakota Distillate Other Adj Sales/Deliveries to Farm Consumers (Thousand Gallons) | |||||
| Decade | Year-0 | Year-1 | Year-2 | Year-3 | Year-4 | Year-5 | Year-6 | Year-7 | Year-8 | Year-9 |
|---|---|---|---|---|---|---|---|---|---|---|
| 1980's | 1,342 | 1,436 | 680 | 2,834 | 2,428 | 7,683 | ||||
| 1990's | 3,573 | 6,316 | 5,177 | 2,167 | 1,789 | 2,904 | 4,802 | 2,627 | 1,052 | 798 |
| 2000's | 810 | 1,436 | 947 | 1,850 | 1,855 | 3,115 | 776 | 593 | 995 | 2,673 |
| 2010's | 1,289 | 1,931 | 1,077 | 2,968 | 1,035 | 1,097 | 1,742 | 4,033 | 3,175 | 1,855 |
| 2020's | 2,270 |
| - = No Data Reported; -- = Not Applicable; NA = Not Available; W = Withheld to avoid disclosure of individual company data. |
| Release Date: 2/9/2022 |
| Next Release Date: Suspended |