|
Download Data (XLS File) |
|
|||||
|
|||||
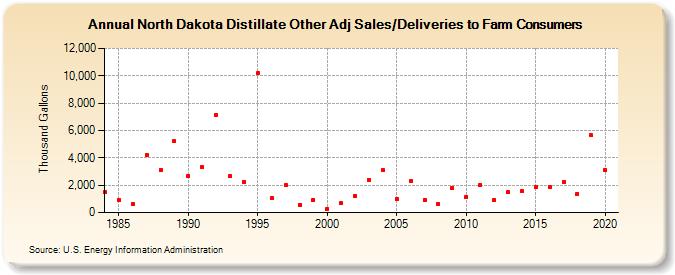
| North Dakota Distillate Other Adj Sales/Deliveries to Farm Consumers (Thousand Gallons) | |||||
| Decade | Year-0 | Year-1 | Year-2 | Year-3 | Year-4 | Year-5 | Year-6 | Year-7 | Year-8 | Year-9 |
|---|---|---|---|---|---|---|---|---|---|---|
| 1980's | 1,473 | 928 | 622 | 4,213 | 3,118 | 5,205 | ||||
| 1990's | 2,708 | 3,314 | 7,149 | 2,665 | 2,239 | 10,181 | 1,042 | 1,995 | 581 | 919 |
| 2000's | 278 | 683 | 1,221 | 2,402 | 3,095 | 975 | 2,280 | 935 | 628 | 1,791 |
| 2010's | 1,160 | 2,043 | 919 | 1,478 | 1,540 | 1,851 | 1,880 | 2,232 | 1,367 | 5,635 |
| 2020's | 3,120 |
| - = No Data Reported; -- = Not Applicable; NA = Not Available; W = Withheld to avoid disclosure of individual company data. |
| Release Date: 2/9/2022 |
| Next Release Date: Suspended |