|
Download Data (XLS File) |
|
|||||
|
|||||
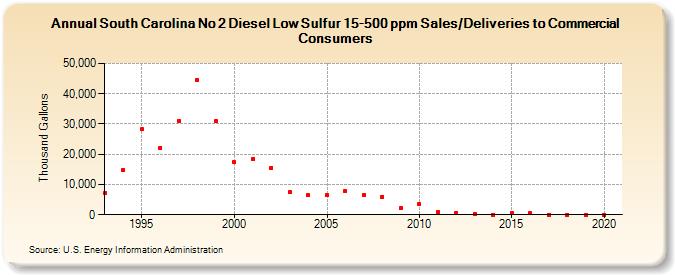
| South Carolina No 2 Diesel Low Sulfur 15-500 ppm Sales/Deliveries to Commercial Consumers (Thousand Gallons) | |||||
| Decade | Year-0 | Year-1 | Year-2 | Year-3 | Year-4 | Year-5 | Year-6 | Year-7 | Year-8 | Year-9 |
|---|---|---|---|---|---|---|---|---|---|---|
| 1990's | 7,232 | 14,947 | 28,297 | 22,154 | 31,122 | 44,620 | 30,878 | |||
| 2000's | 17,287 | 18,453 | 15,537 | 7,371 | 6,367 | 6,472 | 7,715 | 6,653 | 6,008 | 2,295 |
| 2010's | 3,476 | 947 | 635 | 399 | 0 | 488 | 502 | 0 | 0 | 0 |
| 2020's | 0 |
| - = No Data Reported; -- = Not Applicable; NA = Not Available; W = Withheld to avoid disclosure of individual company data. |
| Release Date: 2/9/2022 |
| Next Release Date: Suspended |