|
Download Data (XLS File) |
|
|||||
|
|||||
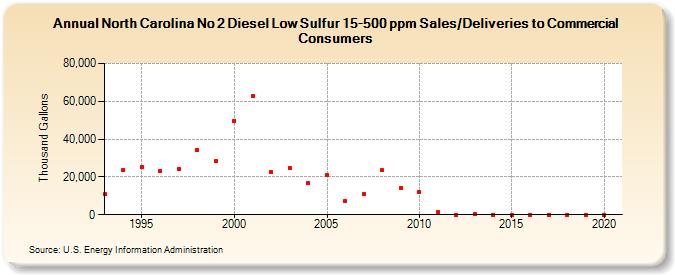
| North Carolina No 2 Diesel Low Sulfur 15-500 ppm Sales/Deliveries to Commercial Consumers (Thousand Gallons) | |||||
| Decade | Year-0 | Year-1 | Year-2 | Year-3 | Year-4 | Year-5 | Year-6 | Year-7 | Year-8 | Year-9 |
|---|---|---|---|---|---|---|---|---|---|---|
| 1990's | 10,784 | 23,762 | 24,991 | 23,170 | 24,182 | 34,471 | 28,659 | |||
| 2000's | 49,721 | 62,648 | 22,449 | 24,755 | 16,683 | 21,008 | 7,068 | 10,841 | 23,390 | 14,172 |
| 2010's | 11,774 | 1,304 | 60 | 179 | 0 | 0 | 0 | 0 | 0 | 0 |
| 2020's | 0 |
| - = No Data Reported; -- = Not Applicable; NA = Not Available; W = Withheld to avoid disclosure of individual company data. |
| Release Date: 2/9/2022 |
| Next Release Date: Suspended |