|
Download Data (XLS File) |
|
|||||
|
|||||
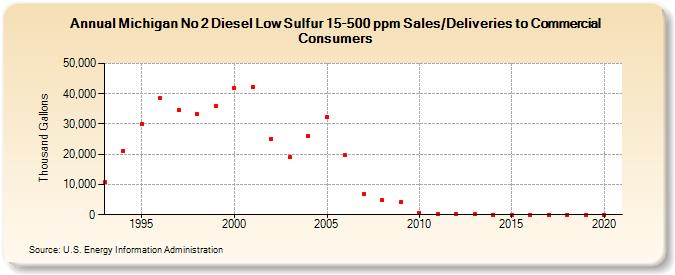
| Michigan No 2 Diesel Low Sulfur 15-500 ppm Sales/Deliveries to Commercial Consumers (Thousand Gallons) | |||||
| Decade | Year-0 | Year-1 | Year-2 | Year-3 | Year-4 | Year-5 | Year-6 | Year-7 | Year-8 | Year-9 |
|---|---|---|---|---|---|---|---|---|---|---|
| 1990's | 10,658 | 21,183 | 29,922 | 38,597 | 34,767 | 33,180 | 36,106 | |||
| 2000's | 41,947 | 42,168 | 25,033 | 18,992 | 26,003 | 32,145 | 19,654 | 6,827 | 4,775 | 4,195 |
| 2010's | 629 | 119 | 74 | 91 | 0 | 0 | 0 | 0 | 0 | 0 |
| 2020's | 0 |
| - = No Data Reported; -- = Not Applicable; NA = Not Available; W = Withheld to avoid disclosure of individual company data. |
| Release Date: 2/9/2022 |
| Next Release Date: Suspended |