|
Download Data (XLS File) |
|
|||||
|
|||||
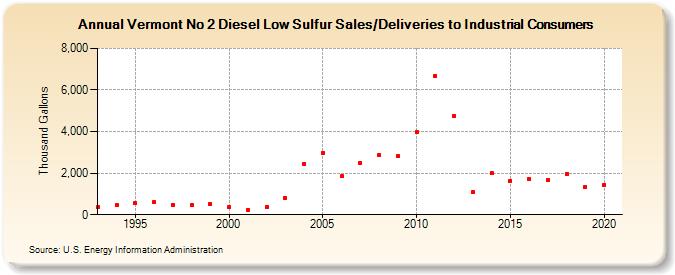
| Vermont No 2 Diesel Low Sulfur Sales/Deliveries to Industrial Consumers (Thousand Gallons) | |||||
| Decade | Year-0 | Year-1 | Year-2 | Year-3 | Year-4 | Year-5 | Year-6 | Year-7 | Year-8 | Year-9 |
|---|---|---|---|---|---|---|---|---|---|---|
| 1990's | 377 | 457 | 546 | 620 | 481 | 457 | 520 | |||
| 2000's | 368 | 229 | 394 | 799 | 2,455 | 2,985 | 1,859 | 2,488 | 2,884 | 2,816 |
| 2010's | 3,978 | 6,677 | 4,761 | 1,089 | 1,987 | 1,645 | 1,705 | 1,663 | 1,973 | 1,348 |
| 2020's | 1,443 |
| - = No Data Reported; -- = Not Applicable; NA = Not Available; W = Withheld to avoid disclosure of individual company data. |
| Release Date: 2/9/2022 |
| Next Release Date: Suspended |