|
Download Data (XLS File) |
|
|||||
|
|||||
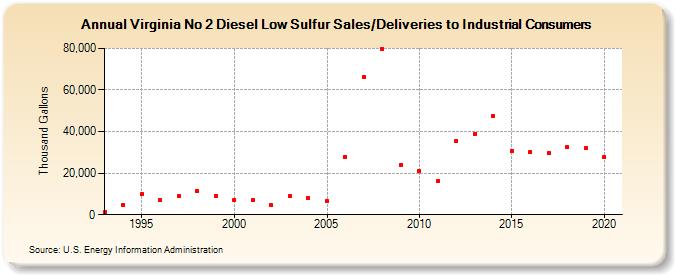
| Virginia No 2 Diesel Low Sulfur Sales/Deliveries to Industrial Consumers (Thousand Gallons) | |||||
| Decade | Year-0 | Year-1 | Year-2 | Year-3 | Year-4 | Year-5 | Year-6 | Year-7 | Year-8 | Year-9 |
|---|---|---|---|---|---|---|---|---|---|---|
| 1990's | 1,286 | 4,717 | 9,938 | 6,871 | 9,234 | 11,338 | 9,167 | |||
| 2000's | 7,129 | 6,838 | 4,516 | 9,110 | 7,982 | 6,359 | 27,966 | 66,285 | 79,928 | 24,074 |
| 2010's | 21,254 | 16,134 | 35,598 | 38,817 | 47,616 | 30,594 | 30,165 | 29,615 | 32,430 | 32,072 |
| 2020's | 27,705 |
| - = No Data Reported; -- = Not Applicable; NA = Not Available; W = Withheld to avoid disclosure of individual company data. |
| Release Date: 2/9/2022 |
| Next Release Date: Suspended |