|
Download Data (XLS File) |
|
|||||
|
|||||
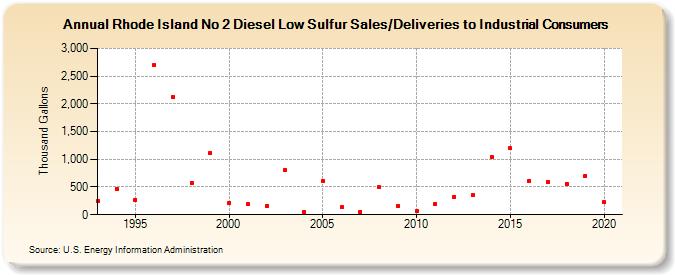
| Rhode Island No 2 Diesel Low Sulfur Sales/Deliveries to Industrial Consumers (Thousand Gallons) | |||||
| Decade | Year-0 | Year-1 | Year-2 | Year-3 | Year-4 | Year-5 | Year-6 | Year-7 | Year-8 | Year-9 |
|---|---|---|---|---|---|---|---|---|---|---|
| 1990's | 254 | 464 | 271 | 2,703 | 2,124 | 574 | 1,116 | |||
| 2000's | 209 | 191 | 162 | 807 | 55 | 610 | 139 | 54 | 493 | 166 |
| 2010's | 61 | 199 | 320 | 357 | 1,044 | 1,196 | 613 | 587 | 562 | 706 |
| 2020's | 226 |
| - = No Data Reported; -- = Not Applicable; NA = Not Available; W = Withheld to avoid disclosure of individual company data. |
| Release Date: 2/9/2022 |
| Next Release Date: Suspended |