|
Download Data (XLS File) |
|
|||||
|
|||||
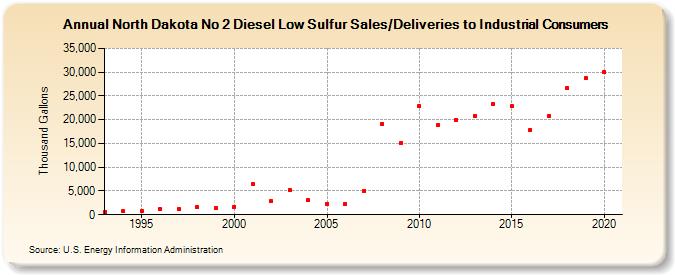
| North Dakota No 2 Diesel Low Sulfur Sales/Deliveries to Industrial Consumers (Thousand Gallons) | |||||
| Decade | Year-0 | Year-1 | Year-2 | Year-3 | Year-4 | Year-5 | Year-6 | Year-7 | Year-8 | Year-9 |
|---|---|---|---|---|---|---|---|---|---|---|
| 1990's | 659 | 691 | 737 | 1,182 | 1,119 | 1,520 | 1,344 | |||
| 2000's | 1,717 | 6,378 | 2,837 | 5,169 | 2,992 | 2,355 | 2,228 | 4,930 | 19,176 | 15,044 |
| 2010's | 22,904 | 18,849 | 19,996 | 20,794 | 23,348 | 22,870 | 17,886 | 20,868 | 26,634 | 28,689 |
| 2020's | 30,081 |
| - = No Data Reported; -- = Not Applicable; NA = Not Available; W = Withheld to avoid disclosure of individual company data. |
| Release Date: 2/9/2022 |
| Next Release Date: Suspended |