|
Download Data (XLS File) |
|
|||||
|
|||||
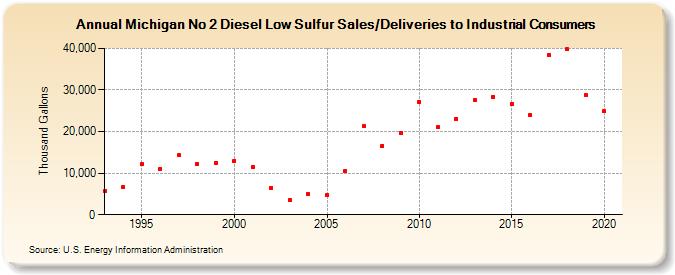
| Michigan No 2 Diesel Low Sulfur Sales/Deliveries to Industrial Consumers (Thousand Gallons) | |||||
| Decade | Year-0 | Year-1 | Year-2 | Year-3 | Year-4 | Year-5 | Year-6 | Year-7 | Year-8 | Year-9 |
|---|---|---|---|---|---|---|---|---|---|---|
| 1990's | 5,675 | 6,722 | 12,234 | 11,008 | 14,265 | 12,187 | 12,440 | |||
| 2000's | 12,938 | 11,457 | 6,483 | 3,541 | 4,946 | 4,787 | 10,527 | 21,259 | 16,644 | 19,761 |
| 2010's | 27,118 | 21,046 | 23,061 | 27,522 | 28,408 | 26,645 | 23,983 | 38,434 | 39,771 | 28,823 |
| 2020's | 24,851 |
| - = No Data Reported; -- = Not Applicable; NA = Not Available; W = Withheld to avoid disclosure of individual company data. |
| Release Date: 2/9/2022 |
| Next Release Date: Suspended |