|
Download Data (XLS File) |
|
|||||
|
|||||
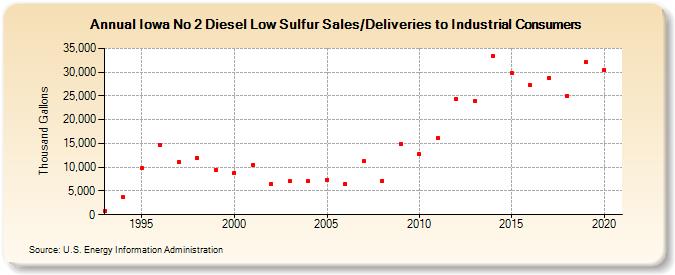
| Iowa No 2 Diesel Low Sulfur Sales/Deliveries to Industrial Consumers (Thousand Gallons) | |||||
| Decade | Year-0 | Year-1 | Year-2 | Year-3 | Year-4 | Year-5 | Year-6 | Year-7 | Year-8 | Year-9 |
|---|---|---|---|---|---|---|---|---|---|---|
| 1990's | 873 | 3,670 | 9,810 | 14,763 | 11,063 | 11,954 | 9,479 | |||
| 2000's | 8,878 | 10,514 | 6,515 | 7,034 | 7,009 | 7,395 | 6,508 | 11,222 | 7,139 | 14,954 |
| 2010's | 12,738 | 16,180 | 24,343 | 23,935 | 33,450 | 29,819 | 27,267 | 28,726 | 24,978 | 32,115 |
| 2020's | 30,458 |
| - = No Data Reported; -- = Not Applicable; NA = Not Available; W = Withheld to avoid disclosure of individual company data. |
| Release Date: 2/9/2022 |
| Next Release Date: Suspended |