|
Download Data (XLS File) |
|
|||||
|
|||||
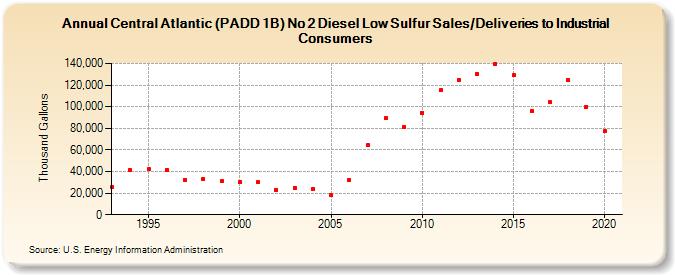
| Central Atlantic (PADD 1B) No 2 Diesel Low Sulfur Sales/Deliveries to Industrial Consumers (Thousand Gallons) | |||||
| Decade | Year-0 | Year-1 | Year-2 | Year-3 | Year-4 | Year-5 | Year-6 | Year-7 | Year-8 | Year-9 |
|---|---|---|---|---|---|---|---|---|---|---|
| 1990's | 25,412 | 41,093 | 42,015 | 41,786 | 32,428 | 33,265 | 30,860 | |||
| 2000's | 30,463 | 29,962 | 22,863 | 25,071 | 23,723 | 17,927 | 32,228 | 64,252 | 89,505 | 81,428 |
| 2010's | 94,615 | 115,085 | 125,082 | 130,366 | 139,681 | 129,034 | 96,180 | 104,060 | 124,456 | 100,107 |
| 2020's | 77,183 |
| - = No Data Reported; -- = Not Applicable; NA = Not Available; W = Withheld to avoid disclosure of individual company data. |
| Release Date: 2/9/2022 |
| Next Release Date: Suspended |