|
Download Data (XLS File) |
|
|||||
|
|||||
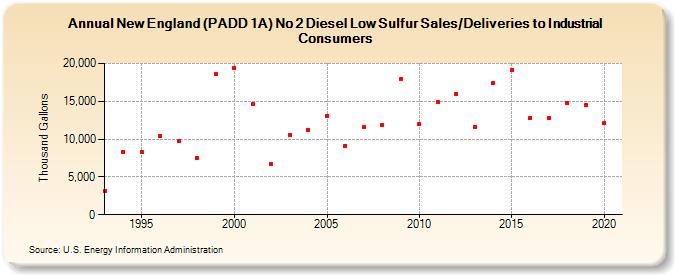
| New England (PADD 1A) No 2 Diesel Low Sulfur Sales/Deliveries to Industrial Consumers (Thousand Gallons) | |||||
| Decade | Year-0 | Year-1 | Year-2 | Year-3 | Year-4 | Year-5 | Year-6 | Year-7 | Year-8 | Year-9 |
|---|---|---|---|---|---|---|---|---|---|---|
| 1990's | 3,146 | 8,268 | 8,271 | 10,437 | 9,766 | 7,552 | 18,616 | |||
| 2000's | 19,419 | 14,616 | 6,679 | 10,580 | 11,216 | 13,084 | 9,093 | 11,631 | 11,866 | 17,999 |
| 2010's | 11,933 | 14,883 | 15,976 | 11,580 | 17,431 | 19,172 | 12,803 | 12,729 | 14,808 | 14,464 |
| 2020's | 12,149 |
| - = No Data Reported; -- = Not Applicable; NA = Not Available; W = Withheld to avoid disclosure of individual company data. |
| Release Date: 2/9/2022 |
| Next Release Date: Suspended |