|
Download Data (XLS File) |
|
|||||
|
|||||
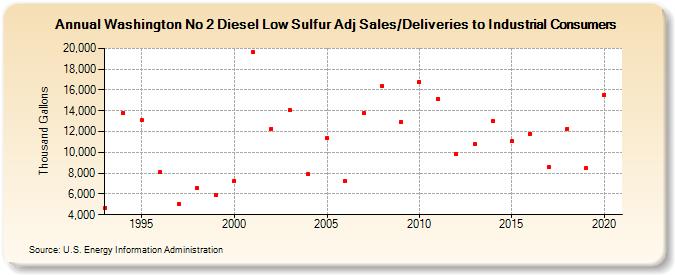
| Washington No 2 Diesel Low Sulfur Adj Sales/Deliveries to Industrial Consumers (Thousand Gallons) | |||||
| Decade | Year-0 | Year-1 | Year-2 | Year-3 | Year-4 | Year-5 | Year-6 | Year-7 | Year-8 | Year-9 |
|---|---|---|---|---|---|---|---|---|---|---|
| 1990's | 4,685 | 13,757 | 13,069 | 8,062 | 5,048 | 6,590 | 5,880 | |||
| 2000's | 7,248 | 19,655 | 12,273 | 14,049 | 7,887 | 11,367 | 7,201 | 13,772 | 16,395 | 12,941 |
| 2010's | 16,812 | 15,158 | 9,795 | 10,763 | 12,976 | 11,088 | 11,793 | 8,542 | 12,292 | 8,481 |
| 2020's | 15,563 |
| - = No Data Reported; -- = Not Applicable; NA = Not Available; W = Withheld to avoid disclosure of individual company data. |
| Release Date: 2/9/2022 |
| Next Release Date: Suspended |