|
Download Data (XLS File) |
|
|||||
|
|||||
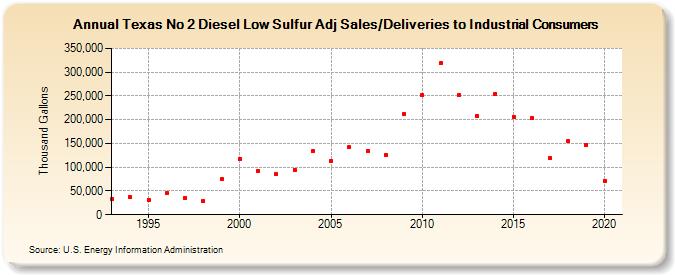
| Texas No 2 Diesel Low Sulfur Adj Sales/Deliveries to Industrial Consumers (Thousand Gallons) | |||||
| Decade | Year-0 | Year-1 | Year-2 | Year-3 | Year-4 | Year-5 | Year-6 | Year-7 | Year-8 | Year-9 |
|---|---|---|---|---|---|---|---|---|---|---|
| 1990's | 32,333 | 36,925 | 31,571 | 44,923 | 36,217 | 28,993 | 75,261 | |||
| 2000's | 117,803 | 92,812 | 84,852 | 94,688 | 133,778 | 113,138 | 142,007 | 134,023 | 126,088 | 211,385 |
| 2010's | 252,315 | 318,631 | 251,865 | 208,236 | 255,042 | 206,326 | 203,018 | 118,862 | 155,548 | 146,474 |
| 2020's | 71,858 |
| - = No Data Reported; -- = Not Applicable; NA = Not Available; W = Withheld to avoid disclosure of individual company data. |
| Release Date: 2/9/2022 |
| Next Release Date: Suspended |