|
Download Data (XLS File) |
|
|||||
|
|||||
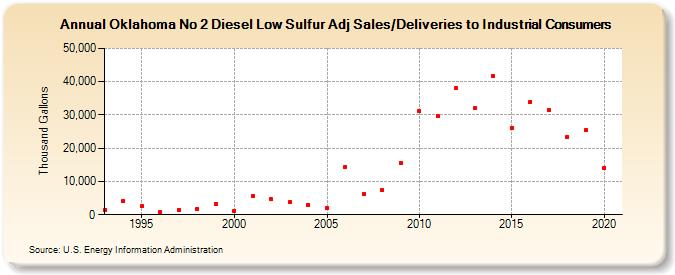
| Oklahoma No 2 Diesel Low Sulfur Adj Sales/Deliveries to Industrial Consumers (Thousand Gallons) | |||||
| Decade | Year-0 | Year-1 | Year-2 | Year-3 | Year-4 | Year-5 | Year-6 | Year-7 | Year-8 | Year-9 |
|---|---|---|---|---|---|---|---|---|---|---|
| 1990's | 1,515 | 4,036 | 2,586 | 760 | 1,380 | 1,780 | 3,360 | |||
| 2000's | 1,216 | 5,617 | 4,596 | 3,813 | 3,061 | 2,054 | 14,461 | 6,372 | 7,501 | 15,655 |
| 2010's | 31,044 | 29,799 | 38,064 | 31,990 | 41,776 | 26,193 | 33,973 | 31,329 | 23,420 | 25,426 |
| 2020's | 14,193 |
| - = No Data Reported; -- = Not Applicable; NA = Not Available; W = Withheld to avoid disclosure of individual company data. |
| Release Date: 2/9/2022 |
| Next Release Date: Suspended |