|
Download Data (XLS File) |
|
|||||
|
|||||
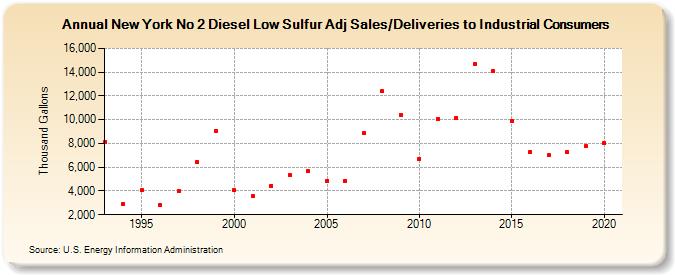
| New York No 2 Diesel Low Sulfur Adj Sales/Deliveries to Industrial Consumers (Thousand Gallons) | |||||
| Decade | Year-0 | Year-1 | Year-2 | Year-3 | Year-4 | Year-5 | Year-6 | Year-7 | Year-8 | Year-9 |
|---|---|---|---|---|---|---|---|---|---|---|
| 1990's | 8,125 | 2,916 | 4,074 | 2,801 | 4,018 | 6,418 | 9,081 | |||
| 2000's | 4,057 | 3,554 | 4,438 | 5,330 | 5,665 | 4,864 | 4,862 | 8,866 | 12,391 | 10,423 |
| 2010's | 6,717 | 10,065 | 10,160 | 14,693 | 14,060 | 9,927 | 7,279 | 7,014 | 7,258 | 7,756 |
| 2020's | 8,017 |
| - = No Data Reported; -- = Not Applicable; NA = Not Available; W = Withheld to avoid disclosure of individual company data. |
| Release Date: 2/9/2022 |
| Next Release Date: Suspended |