|
Download Data (XLS File) |
|
|||||
|
|||||
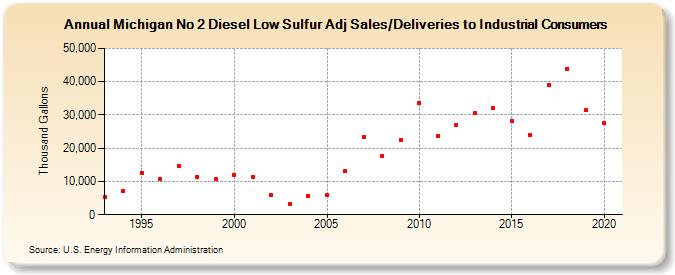
| Michigan No 2 Diesel Low Sulfur Adj Sales/Deliveries to Industrial Consumers (Thousand Gallons) | |||||
| Decade | Year-0 | Year-1 | Year-2 | Year-3 | Year-4 | Year-5 | Year-6 | Year-7 | Year-8 | Year-9 |
|---|---|---|---|---|---|---|---|---|---|---|
| 1990's | 5,446 | 7,052 | 12,587 | 10,790 | 14,584 | 11,469 | 10,725 | |||
| 2000's | 12,080 | 11,428 | 5,779 | 3,162 | 5,665 | 5,779 | 13,189 | 23,384 | 17,672 | 22,490 |
| 2010's | 33,444 | 23,812 | 27,051 | 30,643 | 31,935 | 28,272 | 24,034 | 39,090 | 43,819 | 31,441 |
| 2020's | 27,433 |
| - = No Data Reported; -- = Not Applicable; NA = Not Available; W = Withheld to avoid disclosure of individual company data. |
| Release Date: 2/9/2022 |
| Next Release Date: Suspended |