|
Download Data (XLS File) |
|
|||||
|
|||||
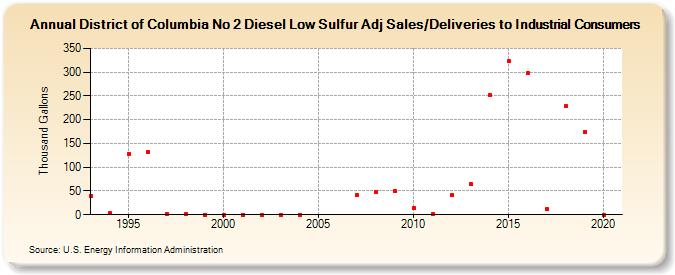
| District of Columbia No 2 Diesel Low Sulfur Adj Sales/Deliveries to Industrial Consumers (Thousand Gallons) | |||||
| Decade | Year-0 | Year-1 | Year-2 | Year-3 | Year-4 | Year-5 | Year-6 | Year-7 | Year-8 | Year-9 |
|---|---|---|---|---|---|---|---|---|---|---|
| 1990's | 39 | 3 | 128 | 133 | 2 | 1 | 0 | |||
| 2000's | 0 | 0 | 0 | 0 | 0 | -- | -- | 42 | 48 | 49 |
| 2010's | 15 | 2 | 41 | 64 | 251 | 323 | 298 | 11 | 228 | 174 |
| 2020's | 0 |
| - = No Data Reported; -- = Not Applicable; NA = Not Available; W = Withheld to avoid disclosure of individual company data. |
| Release Date: 2/9/2022 |
| Next Release Date: Suspended |