|
Download Data (XLS File) |
|
|||||
|
|||||
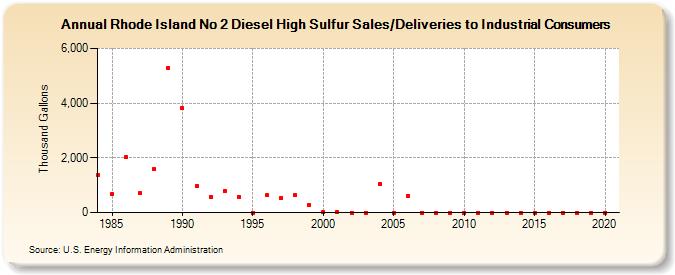
| Rhode Island No 2 Diesel High Sulfur Sales/Deliveries to Industrial Consumers (Thousand Gallons) | |||||
| Decade | Year-0 | Year-1 | Year-2 | Year-3 | Year-4 | Year-5 | Year-6 | Year-7 | Year-8 | Year-9 |
|---|---|---|---|---|---|---|---|---|---|---|
| 1980's | 1,384 | 685 | 2,018 | 715 | 1,584 | 5,279 | ||||
| 1990's | 3,820 | 970 | 585 | 788 | 586 | 1 | 625 | 537 | 630 | 284 |
| 2000's | 17 | 15 | 0 | 0 | 1,045 | 0 | 613 | 0 | 0 | 0 |
| 2010's | 0 | 0 | 0 | 0 | 0 | 0 | 0 | 0 | 0 | 0 |
| 2020's | 0 |
| - = No Data Reported; -- = Not Applicable; NA = Not Available; W = Withheld to avoid disclosure of individual company data. |
| Release Date: 2/9/2022 |
| Next Release Date: Suspended |